Hey there Axon Community,
we are currently dealing with a problem when processing a batch of nested commands.
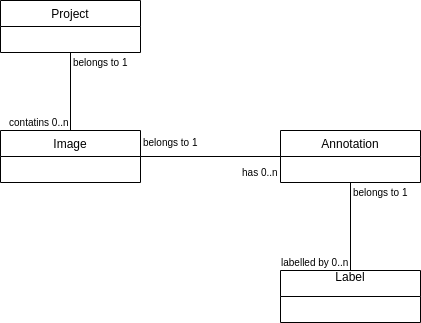
We are developing an application based on Axon 4.4 that consists of several separate aggregate roots which are related to each other in 1:n relationships. The relationships are expressed as the aggregate identifier of the single-sided aggregate root stored as parent id in the multi-sided aggregate root.
We deliberately have chosen to use distinct aggregate roots instead of aggregate members due to scalability reasons (mainly to avoid huge numbers of events stored to a single aggregate instance for a hierarchical object graph, see example below)
There are some use-cases, where we need to propagate an action through the whole tree of connected aggregates. To achieve such operations we maintain a command model that stores the parent-child relationships. Propagating such an action is usually done in the following way (example use case is granting access to a project and all of it’s subitems):
- publish
ProjectGrantAccessCommand ProjectAggregate:handle(ProjectGrantAccessCommand)
a. publishProjectAccessGrantedEvent
b.CommandModel:getDescendants
c. for each descendant image root: publishImageGrantAccessCommand
this pattern is repeated in the next level of the hierarchy for each of the descendants
ImageAggregate:handle(ImageGrantAccessCommand)
a. publishImageAccessGrantedEvent
b.CommandModel:getDescendants
c. for each descendant annotation root:AnnotationGrantAccessCommand
… and so forth with the further levels of the hierarchy.
Having relationships of 1 Project → 80 Images/Project → 1000 Annotations/Image this produces ~80k commands. We are using Axon Server EE and the DisruptorCommandBus as the local segment of the distributed command bus. Since we experience extreme slow processing of the 80k commands (~8 hrs) we have set up two micrometer timers on the command handlers and the Unit of work like below:
public class CommandTimingInterceptor implements MessageHandlerInterceptor<CommandMessage<?>> {

    private MeterRegistry registry;

    public CommandTimingInterceptor(MeterRegistry registry) {
        this.registry = registry;
    }

    @Override
    public Object handle(UnitOfWork<? extends CommandMessage<?>> unitOfWork, InterceptorChain interceptorChain) throws Exception {
        final Optional<LongTaskTimer.Sample> uowSample =
            buildUowTimer(unitOfWork.getMessage().getCommandName()).map(LongTaskTimer::start);
        unitOfWork.onCleanup(uow -> uowSample.ifPresent(this::stopTimer));
        final Optional<LongTaskTimer.Sample> cmdSample =
            buildCommandTimer(unitOfWork.getMessage().getCommandName()).map(LongTaskTimer::start);
        try {
            return interceptorChain.proceed();
        } finally {
            cmdSample.ifPresent(this::stopTimer);
        }
    }

   // ...
}
and the pattern we see is the following:
- the commands are finishing really fast (under a second, not visible in the graph), but the related unit of work (red line for the ProjectGrantAccessCommand) seems to block until all of the child commands are processed
- the pattern repeats for the ImageGrantAccessCommand and Unit of Work (blue lines / spikes)

Since we are using the async CommandGateway::send which returns immediately and let’s the command handler finish I’m a bit puzzled what may be blocking the Unit of Work until it’s cleanup phase (where we stop the micrometer timer)? It even looks as if all of the subsequent commands somehow “block” the Unit of Work of the ProjectGrantAccessCommand handling.
I started some serious debugging of the framework to better understand the Unit of Work handling but it’s quite hard to track down. Maybe someone here has an idea or experienced a similar behaviour - appreciate every hint where to look.
Best Regards,
Jakob