Using Kafka as our message broker. We’re running repeated experiments of processing approximately 15k events. When processing these through kafkacat the total time is less a second.
When processing these events through our axon service it takes over 3 minutes with batching enabled (we’ve tried a range of values from 20-500 with no apparent difference). We’ve profiled our actually processing work and found it to be not even 1ms in time per event (all events are the same). We don’t see spikes in memory and cpu hovers around 80%. We believe the bottleneck is updating tokens and domain_event_entry tables. How can we improve this performance?
Hi Michael,
From a performance tuning perspective, we (AxonIQ) have some material laying around to explain how to achieve this.
Check out this presentation Allard did at JPoint (Moscow) this year for example: https://www.youtube.com/watch?v=U6s3D8GoHaw
Or, this blog that Frans wrote about replay performance, which in essence is identical to handling big chunks of events: https://axoniq.io/blog-overview/cqrs-replay-performance-tuning
I am assuming the shared information is sufficient.
If not, feel free to contact us directly at AxonIQ for further help.
Cheers,
Steven van Beelen
Axon Framework Lead Developer
Hi Steven,
Do you happen to have some performance benchmarks or recommendations about how much memory AxonServer needs for good replay performance?
I'm nowhere near the numbers mentioned in the talk/Frans' article.. haven't done thorough profiling yet, but removed the read db completely, event handlers in the projection do nothing but print something (no db connection), I've increased the batch size, also multithreaded.. 4 core 10gb machine, ssd, 100k events.. but very slow, wondering why, need to get to the bottom of this. I would appreciate some educated guesses before I spend more time for investigating, I'm painfully overlooking something I'm afraid.
Thanks
Hi Vilmos,
your best next step would be to use a profiler to find out where time is spent. 4 core machines for AxonServer should easily be able to process large volumes of events. 100k events aren’t even that much. It shouldn’t take much more than a few seconds to process that.
What is “very slow” in your case?
Cheers,
Allard
Hi Allard,
Thanks for the answer, I’ve managed to do a bit more testing. What I see is very odd. When I start the replay, CPU consumption goes up to 100% as expected, but very soon, after like 10s it goes down to 20% and that’s it, from that point I cannot see CPU/memory/IO pressure, resource usage is quite low, it’s as if flow control would no allow to get more messages. I maxed out all the flow control/permit related values in the projection (initial number of permits etc.)
For the test’s sake I’m using an in-memory token store, and event listeners only print something, so no db operations involved, the service could not be any simpler. Batch size is set to 1000 but it does not seem to matter, makes no difference. I’ve put AxonServer on a dedicated machine with 4 cores and 30GB RAM, SSD … but that does not change anything, it’s simply not spinning as it should, I can’t wrap my head around why I don’t see 100% CPU utilisation, or memory pressure or something … at the end I get like 1k events/s as an average, which I know is ridiculously low, but could be many times faster if it used all the available resources.
Same results locally or on GCP, same results with mongo or in-memory token store etc. obviously doing something wrong … but I cannot raise the permit settings any more, still seems like something flow control related.
Could you point me to any direction? What am I missing here?
Thanks,
Regards
Hi,
I’ve done some more testing, it is still very strange.
I’ve created some sample event stores for the sake of the test with 1M events:
I insert random events from my test (generic or domain event messages, 5 different types),
1M events gets processed under 57s with that event store with this simplest projection:
@Component
class TestProjection {
@EventHandler
fun on(event: SomethingAddedEvent) = println(“test${UUID.randomUUID().toString()}”)
}
That’s 17.5k events/s on my local machine, decent enough.
When I run this exact test query service with the exact same settings with this exact same
dumb projection on the other event store (where I expecience the slowness),
it gets really slow again: 100k events under 2m34s … ridiculous. That’s 650 events/s …
27 times slower?? I mean what the heck … this projection is not event interested in those
events, I’d expect this to be event faster, since nothing needs to be deserialized, right?
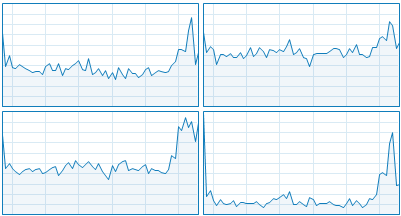
Meanwhile CPU usage is really low:

Like it’s just farting around and not willing to process my events … how come … is there
something “wrong” with that event store? Nothing special there … no huge events, in the config
I don’t have upcasters, in memory token store, sequencing policy set to full parallel …
everything is the simplest possible.
And with the event stores I create from my test cases it is always fast … I’m unable to reproduce the slowness
that way, but with my old event store it is always that slow, regardless of the projection.
It is embarrassing … even more embarrassing, I’m out of ideas how to get to the bottom of this.
Any help what can cause this or how can I profile something like this?
(version is 4.2 now)
Thanks
Hi Vilmos,
this is very strange indeed. The numbers from Frans’ article are created using pretty standard instances on GCP. We haven’t recently done a benchmark, as they always prove useless to prove any point in general. But more than 10k events per second should not be a great challenge. 100k events should be a matter of a few seconds, at most.
When you say “I create a few event stores”, what do you exactly mean? Are they different AxonServer instances with a data set?
You mention the version is 4.2. Is that for AxonFramework, AxonServer, or both?
Cheers,
