Hello Steven,
Thank you for the reply! All is well here, except for this inconvenience 
There was a moment where we thought we fixed it, but it seems we are stuck again.
We did learn that this problem persists over restarts. As far as I can see in the logs, the broken processor does nothing from the start. I can see nothing in the logs from it’s Thread.
Here’s a sample from the token_entry table:
brokenProcessor 2019-07-10T12:40:29.416817Z <org.axonframework.eventhandling.GapAwareTrackingToken>3097400<java.util.concurrent.ConcurrentSkipListMap>3096751true3096752true3096754true3096758true3096763true3096766true3096769true3096771true3096773true3096777true3096780true3096783true3096784true3096788true3096791true3096792true3096797true3096801true3096804true3096807true3096808true3096811true3096812true3096814true3096820true3096822true3096825true3096826true3096830true3096831true3096842true3096844true3096845true3096848true3096850true3096853true3096854true3096857trueSOME_MORE</java.util.concurrent.ConcurrentSkipListMap></org.axonframework.eventhandling.GapAwareTrackingToken>
workingProcessor 2019-07-10T14:34:24.43648Z <org.axonframework.eventhandling.GapAwareTrackingToken>3108693<java.util.concurrent.ConcurrentSkipListMap></java.util.concurrent.ConcurrentSkipListMap></org.axonframework.eventhandling.GapAwareTrackingToken>
workingProcessor 2019-07-10T14:34:27.168501Z <org.axonframework.eventhandling.GapAwareTrackingToken>3114859<java.util.concurrent.ConcurrentSkipListMap>3114682true3114684true3114687true3114694true3114698true3114699true3114701true3114711true3114712true3114714true3114716true3114720true3114721true3114725true3114728true3114731true3114732true3114738true3114744true3114752true3114754true3114758true3114761true3114765true3114767true3114770true3114771true3114773true3114776true3114780true3114787true3114790true3114793true3114797true3114798true3114800true3114804true3114805true3114815true3114819true3114824true3114827true3114838true3114841true3114845true3114851true3114852true3114857true3114858true</java.util.concurrent.ConcurrentSkipListMap></org.axonframework.eventhandling.GapAwareTrackingToken>
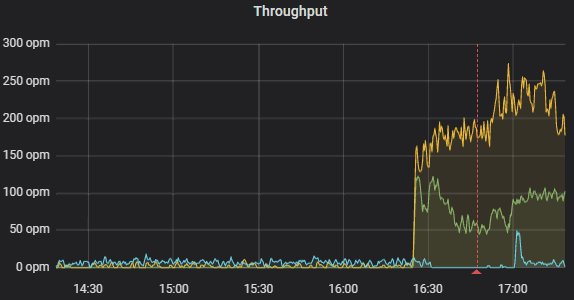
I find it weird that the brokenProcessor has a timestamp of 12:40, the moment when everything was still working. As you can see in the index, it is far behind on the working processors, which all have a number around 3114859.
This fits with what we see in the service that brokenProcessor is supposed to call. The dotted lines in the image represent redeploys of the axon application.
We cannot remove the @Transactional annotation at this time because it causes one of our tests to fail. With the @Transactional annotation, Axon will automatically retry after 1s, 2s, 4s,…, 60s. It will keep doing this until it works, which is what we want. Without this annotation we do not get an automatic retry. Are we abusing something here we shouldn’t do? What would you recommend to get this retry behavior on our EventHandlers?
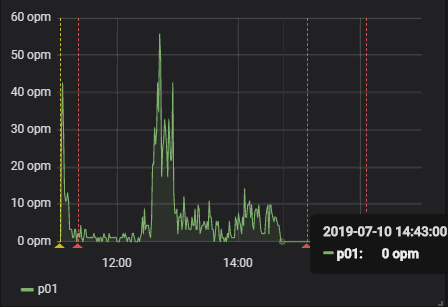
We are also unsure if this is caused by high load. We tried a small load test on our machines where we fed the system 2500 cases in 5 minutes, which due to some slow service calls took about half an hour to process. In the end everything worked and all cases completed to the end, including the brokenProcessor.
`
“EventProcessor[brokenProcessor]-0” #59
Thread State: RUNNABLE
at java.net.SocketInputStream.socketRead0(Native Method)
at java.net.SocketInputStream.socketRead(Unknown Source)
at java.net.SocketInputStream.read(Unknown Source)
at java.net.SocketInputStream.read(Unknown Source)
at oracle.net.ns.Packet.receive(Packet.java:311)
at oracle.net.ns.DataPacket.receive(DataPacket.java:105)
at oracle.net.ns.NetInputStream.getNextPacket(NetInputStream.java:305)
at oracle.net.ns.NetInputStream.read(NetInputStream.java:249)
at oracle.net.ns.NetInputStream.read(NetInputStream.java:171)
at oracle.net.ns.NetInputStream.read(NetInputStream.java:89)
at oracle.jdbc.driver.T4CSocketInputStreamWrapper.readNextPacket(T4CSocketInputStreamWrapper.java:123)
at oracle.jdbc.driver.T4CSocketInputStreamWrapper.read(T4CSocketInputStreamWrapper.java:79)
at oracle.jdbc.driver.T4CMAREngineStream.unmarshalUB1(T4CMAREngineStream.java:426)
at oracle.jdbc.driver.T4CTTIfun.receive(T4CTTIfun.java:390)
at oracle.jdbc.driver.T4CTTIfun.doRPC(T4CTTIfun.java:249)
at oracle.jdbc.driver.T4C8Oall.doOALL(T4C8Oall.java:566)
at oracle.jdbc.driver.T4CPreparedStatement.doOall8(T4CPreparedStatement.java:215)
at oracle.jdbc.driver.T4CPreparedStatement.doOall8(T4CPreparedStatement.java:58)
at oracle.jdbc.driver.T4CPreparedStatement.executeForDescribe(T4CPreparedStatement.java:776)
at oracle.jdbc.driver.OracleStatement.executeMaybeDescribe(OracleStatement.java:897)
at oracle.jdbc.driver.OracleStatement.doExecuteWithTimeout(OracleStatement.java:1034)
at oracle.jdbc.driver.OraclePreparedStatement.executeInternal(OraclePreparedStatement.java:3820)
at oracle.jdbc.driver.OraclePreparedStatement.executeQuery(OraclePreparedStatement.java:3867)
- locked <0x0000000015091697> (a oracle.jdbc.driver.T4CConnection)
at oracle.jdbc.driver.OraclePreparedStatementWrapper.executeQuery(OraclePreparedStatementWrapper.java:1502)
at com.zaxxer.hikari.pool.ProxyPreparedStatement.executeQuery(ProxyPreparedStatement.java:52)
at com.zaxxer.hikari.pool.HikariProxyPreparedStatement.executeQuery(HikariProxyPreparedStatement.java:-1)
at org.hibernate.engine.jdbc.internal.ResultSetReturnImpl.extract(ResultSetReturnImpl.java:60)
at org.hibernate.loader.plan.exec.internal.AbstractLoadPlanBasedLoader.getResultSet(AbstractLoadPlanBasedLoader.java:419)
at org.hibernate.loader.plan.exec.internal.AbstractLoadPlanBasedLoader.executeQueryStatement(AbstractLoadPlanBasedLoader.java:191)
at org.hibernate.loader.plan.exec.internal.AbstractLoadPlanBasedLoader.executeLoad(AbstractLoadPlanBasedLoader.java:121)
at org.hibernate.loader.plan.exec.internal.AbstractLoadPlanBasedLoader.executeLoad(AbstractLoadPlanBasedLoader.java:86)
at org.hibernate.loader.entity.plan.AbstractLoadPlanBasedEntityLoader.load(AbstractLoadPlanBasedEntityLoader.java:188)
at org.hibernate.persister.entity.AbstractEntityPersister.load(AbstractEntityPersister.java:4273)
at org.hibernate.event.internal.DefaultLoadEventListener.loadFromDatasource(DefaultLoadEventListener.java:511)
at org.hibernate.event.internal.DefaultLoadEventListener.doLoad(DefaultLoadEventListener.java:481)
at org.hibernate.event.internal.DefaultLoadEventListener.load(DefaultLoadEventListener.java:222)
at org.hibernate.event.internal.DefaultLoadEventListener.lockAndLoad(DefaultLoadEventListener.java:406)
at org.hibernate.event.internal.DefaultLoadEventListener.doOnLoad(DefaultLoadEventListener.java:127)
at org.hibernate.event.internal.DefaultLoadEventListener.onLoad(DefaultLoadEventListener.java:92)
at org.hibernate.internal.SessionImpl.fireLoad(SessionImpl.java:1257)
at org.hibernate.internal.SessionImpl.access$2000(SessionImpl.java:208)
at org.hibernate.internal.SessionImpl$IdentifierLoadAccessImpl.doLoad(SessionImpl.java:2874)
at org.hibernate.internal.SessionImpl$IdentifierLoadAccessImpl.load(SessionImpl.java:2855)
at org.hibernate.internal.SessionImpl.find(SessionImpl.java:3490)
at org.hibernate.internal.SessionImpl.find(SessionImpl.java:3464)
at jdk.internal.reflect.NativeMethodAccessorImpl.invoke0(Native Method)
at jdk.internal.reflect.NativeMethodAccessorImpl.invoke(Unknown Source)
at jdk.internal.reflect.DelegatingMethodAccessorImpl.invoke(Unknown Source)
at java.lang.reflect.Method.invoke(Unknown Source)
at org.springframework.orm.jpa.SharedEntityManagerCreator$SharedEntityManagerInvocationHandler.invoke(SharedEntityManagerCreator.java:308)
at com.sun.proxy.$Proxy173.find(Unknown Source)
at org.axonframework.eventhandling.tokenstore.jpa.JpaTokenStore.loadToken(JpaTokenStore.java:216)
at org.axonframework.eventhandling.tokenstore.jpa.JpaTokenStore.fetchToken(JpaTokenStore.java:167)
at org.axonframework.eventhandling.TrackingEventProcessor$WorkerLauncher.lambda$run$1(TrackingEventProcessor.java:1053)
at org.axonframework.eventhandling.TrackingEventProcessor$WorkerLauncher$$Lambda$1256/0x0000000100f23440.run(Unknown Source)
at org.axonframework.common.transaction.TransactionManager.executeInTransaction(TransactionManager.java:47)
at org.axonframework.eventhandling.TrackingEventProcessor$WorkerLauncher.run(TrackingEventProcessor.java:1052)
at java.lang.Thread.run(Unknown Source)
`