Decided to perform a simple load test: generate billion events for n number of aggregates and noticed that events throughput
degrade over time with storage size growth. Started to experiment with aggregate number and it looks like having less active aggregates
and the same amount of events will lead to faster throughput degradation. I suspect that the more events there are per aggregate, the slower
overall speed is.
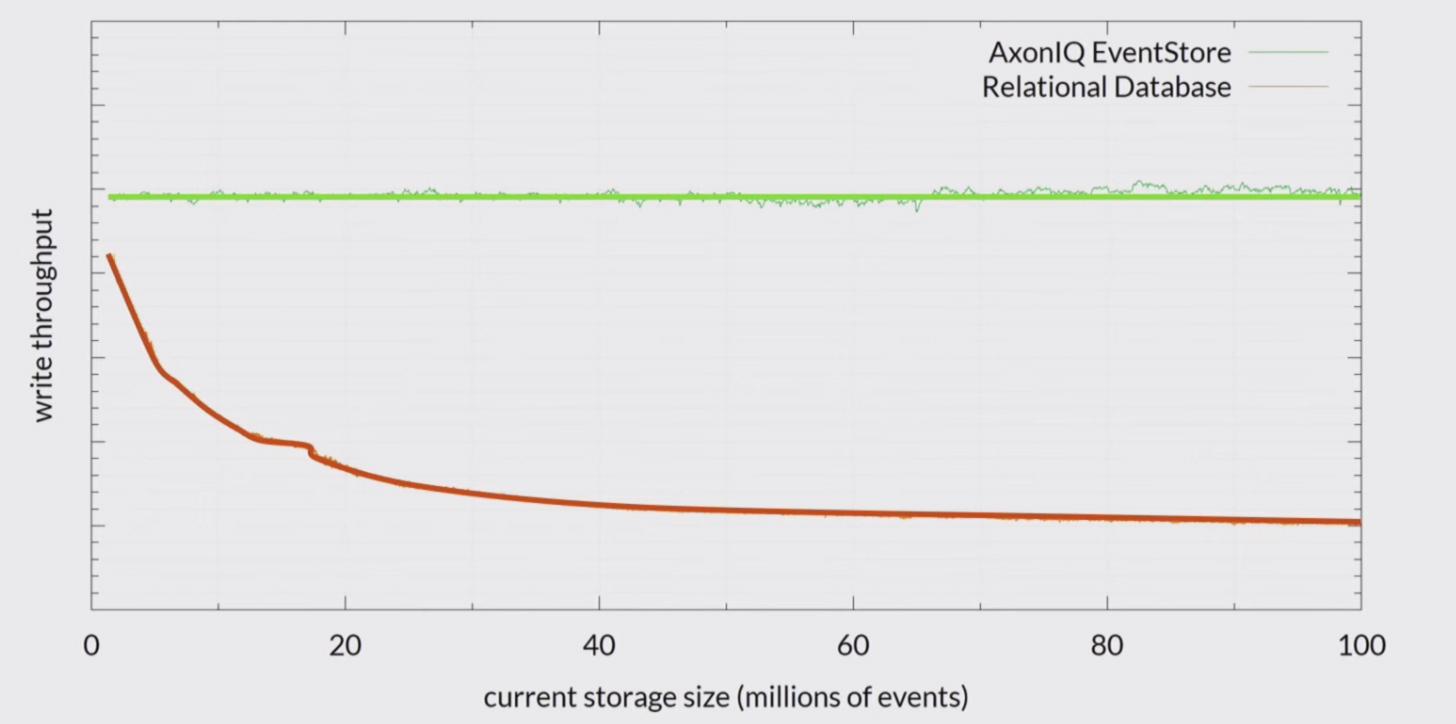
This conclusion contradicts to the slide I’ve found in the web, so probably I’m missing something
I am not performing any reads or replay, just append.
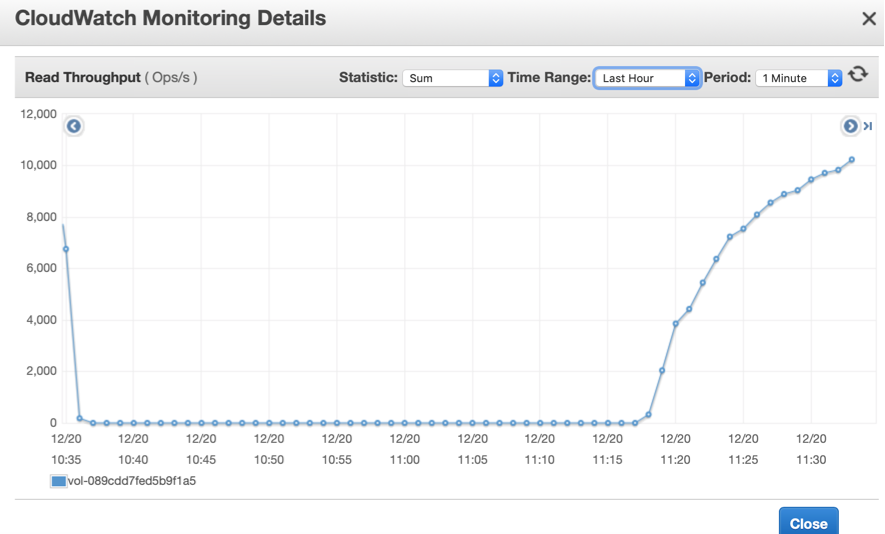
Any ideas on what might be causing such huge increase of reads, only after 3 millions of events (100 000 different aggreagtes) ?
which version of AxonServer have you been using during this test? We are aware of some “eager cache dropping” in earlier versions.
Also, there are a few settings that we found are on the low side by default, especially when using a single, high-throughput, context.
The interesting ones are
“axoniq.axonserver.event.max-bloom-filters-in-memory”, which defaults to 100 and can easily be in the several thousands.
Another one is:
“axoniq.axonserver.event.max-indexes-in-memory” , which defaults to 50 and could also be increased (probably to several hundreds at most), as this uses memory-mapped files.
Note that when appending, AxonServer needs to validate the sequence numbers. These reads are probably caused by the mechanism that validates those sequences. As you have many aggregate, there is a high probability that the sequences for aggregates are further towards in the front of the stream.
Last question, do you use an event sourced aggregate to emit the events, or are you directly appending them to the Event Store?
Hi Allard
I’m using axon server version 4.2.4 launched as docker container from official image.
I’m generating events in a pretty straightforward way: some random command type from a pool of total 4 commands and some random aggregate from total 10 000 aggregates.
I’ve tried these properties (max bloom filters = 10000, max indexes in memory = 900) and looks like situation improved - I haven’t noticed such a huge disk utilization yet.
But overall speed of appending events still decreases over time. It started with something like 1500 events per second and in 2 days went down to 60 events per second (according to axon dashboard).
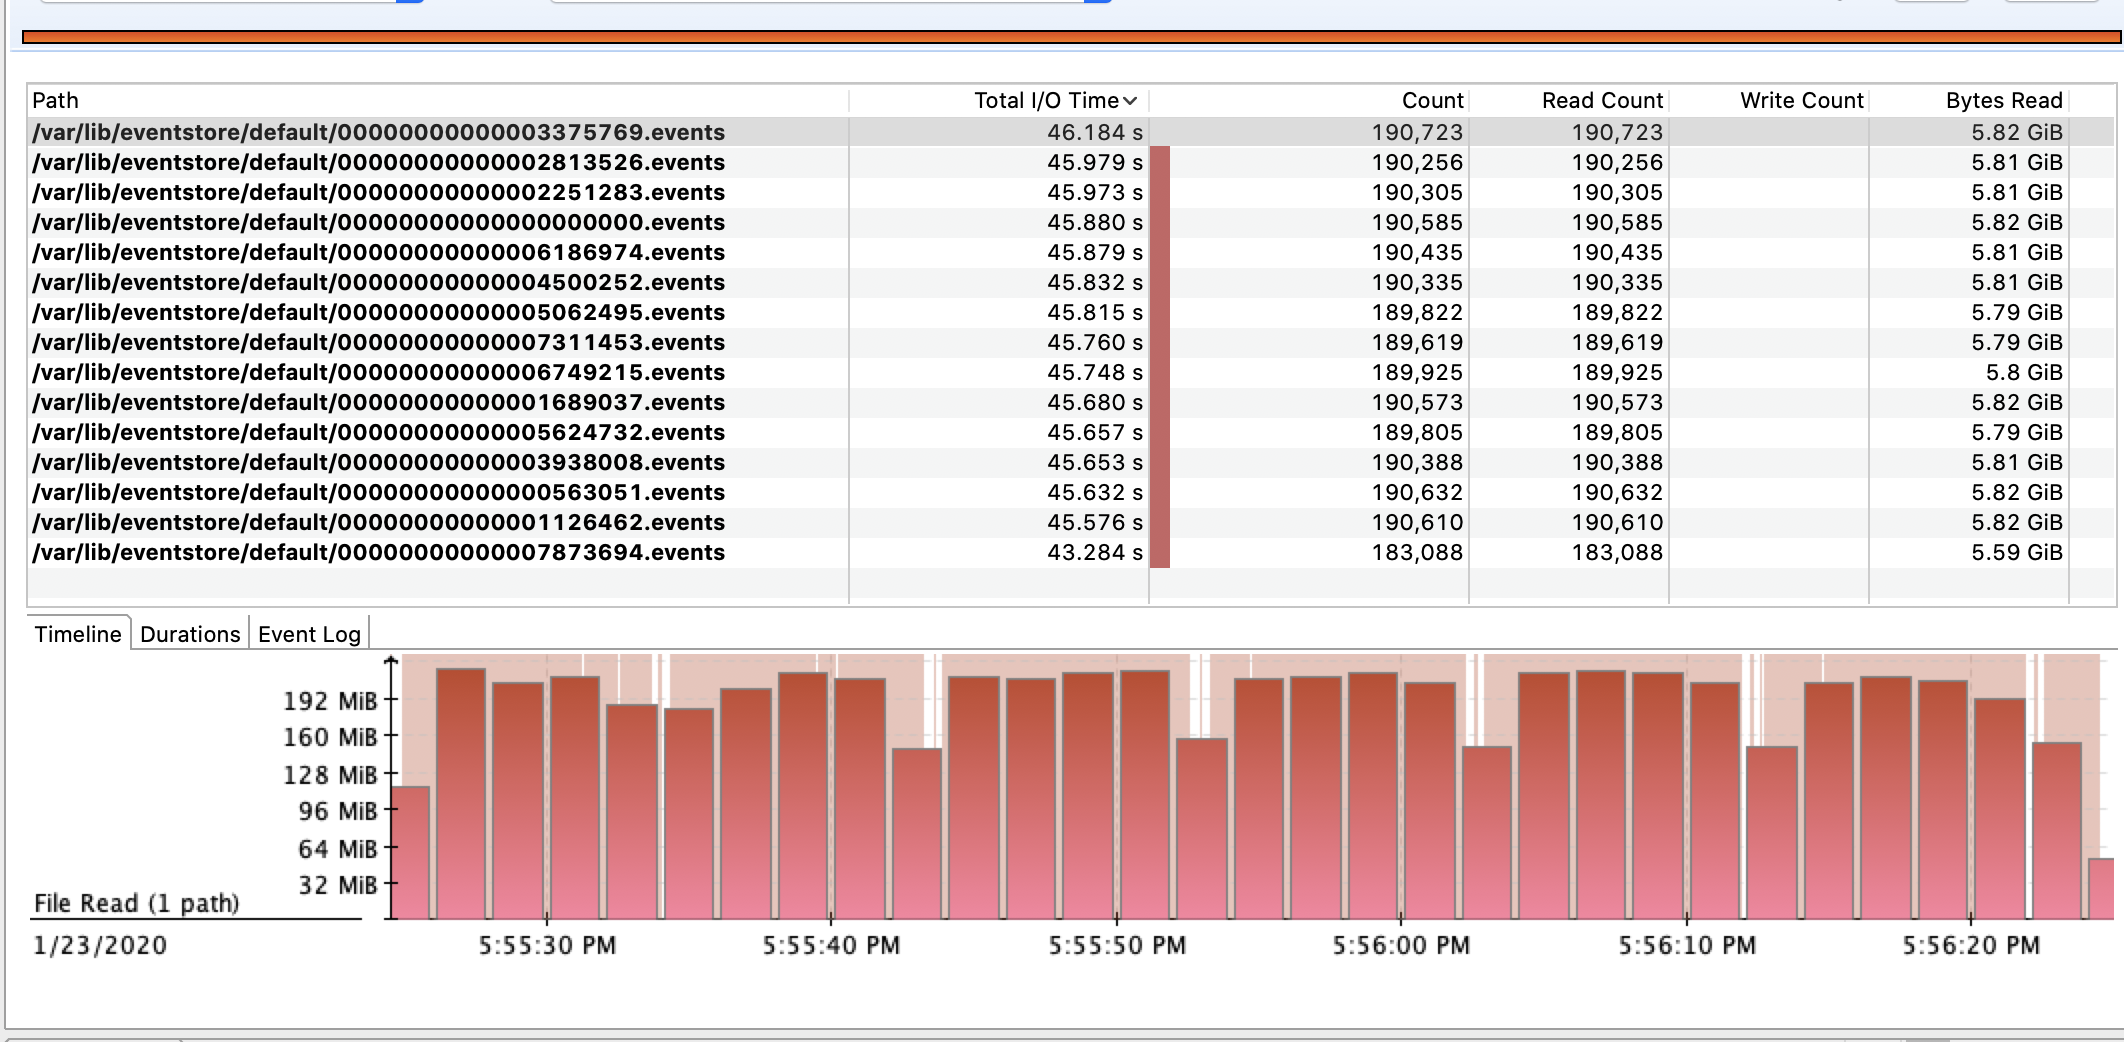
Gave it 6GB xmx and looks like it doesn’t need so much (using around 4.5GB). Cpu is not heavy loaded as well. JMC is showing the following:
If understand this correctly the more files I have (more events stored) the more of them need to be read and could it be the reason causing my problem ?
Also noticed that exceptions per second is pretty high. Around 1500 exceptions per second.
Last question, do you use an event sourced aggregate to emit the events, or are you directly appending them to the Event Store?
Not pretty sure what do you mean by that. I’m using the standard way described in documentation for event sourced aggregates and not for state stored aggregates.
you can try to decrease Java max heap size and increase DirectMemory size (-XX:MaxDirectMemorySize=6g). In my case this helps (with increasing number of files kept in memory).
Hi Aleksey
Thanks for suggestion.
I’ve tried and while time spend in reading files decreased problem with speed decrease still remained.
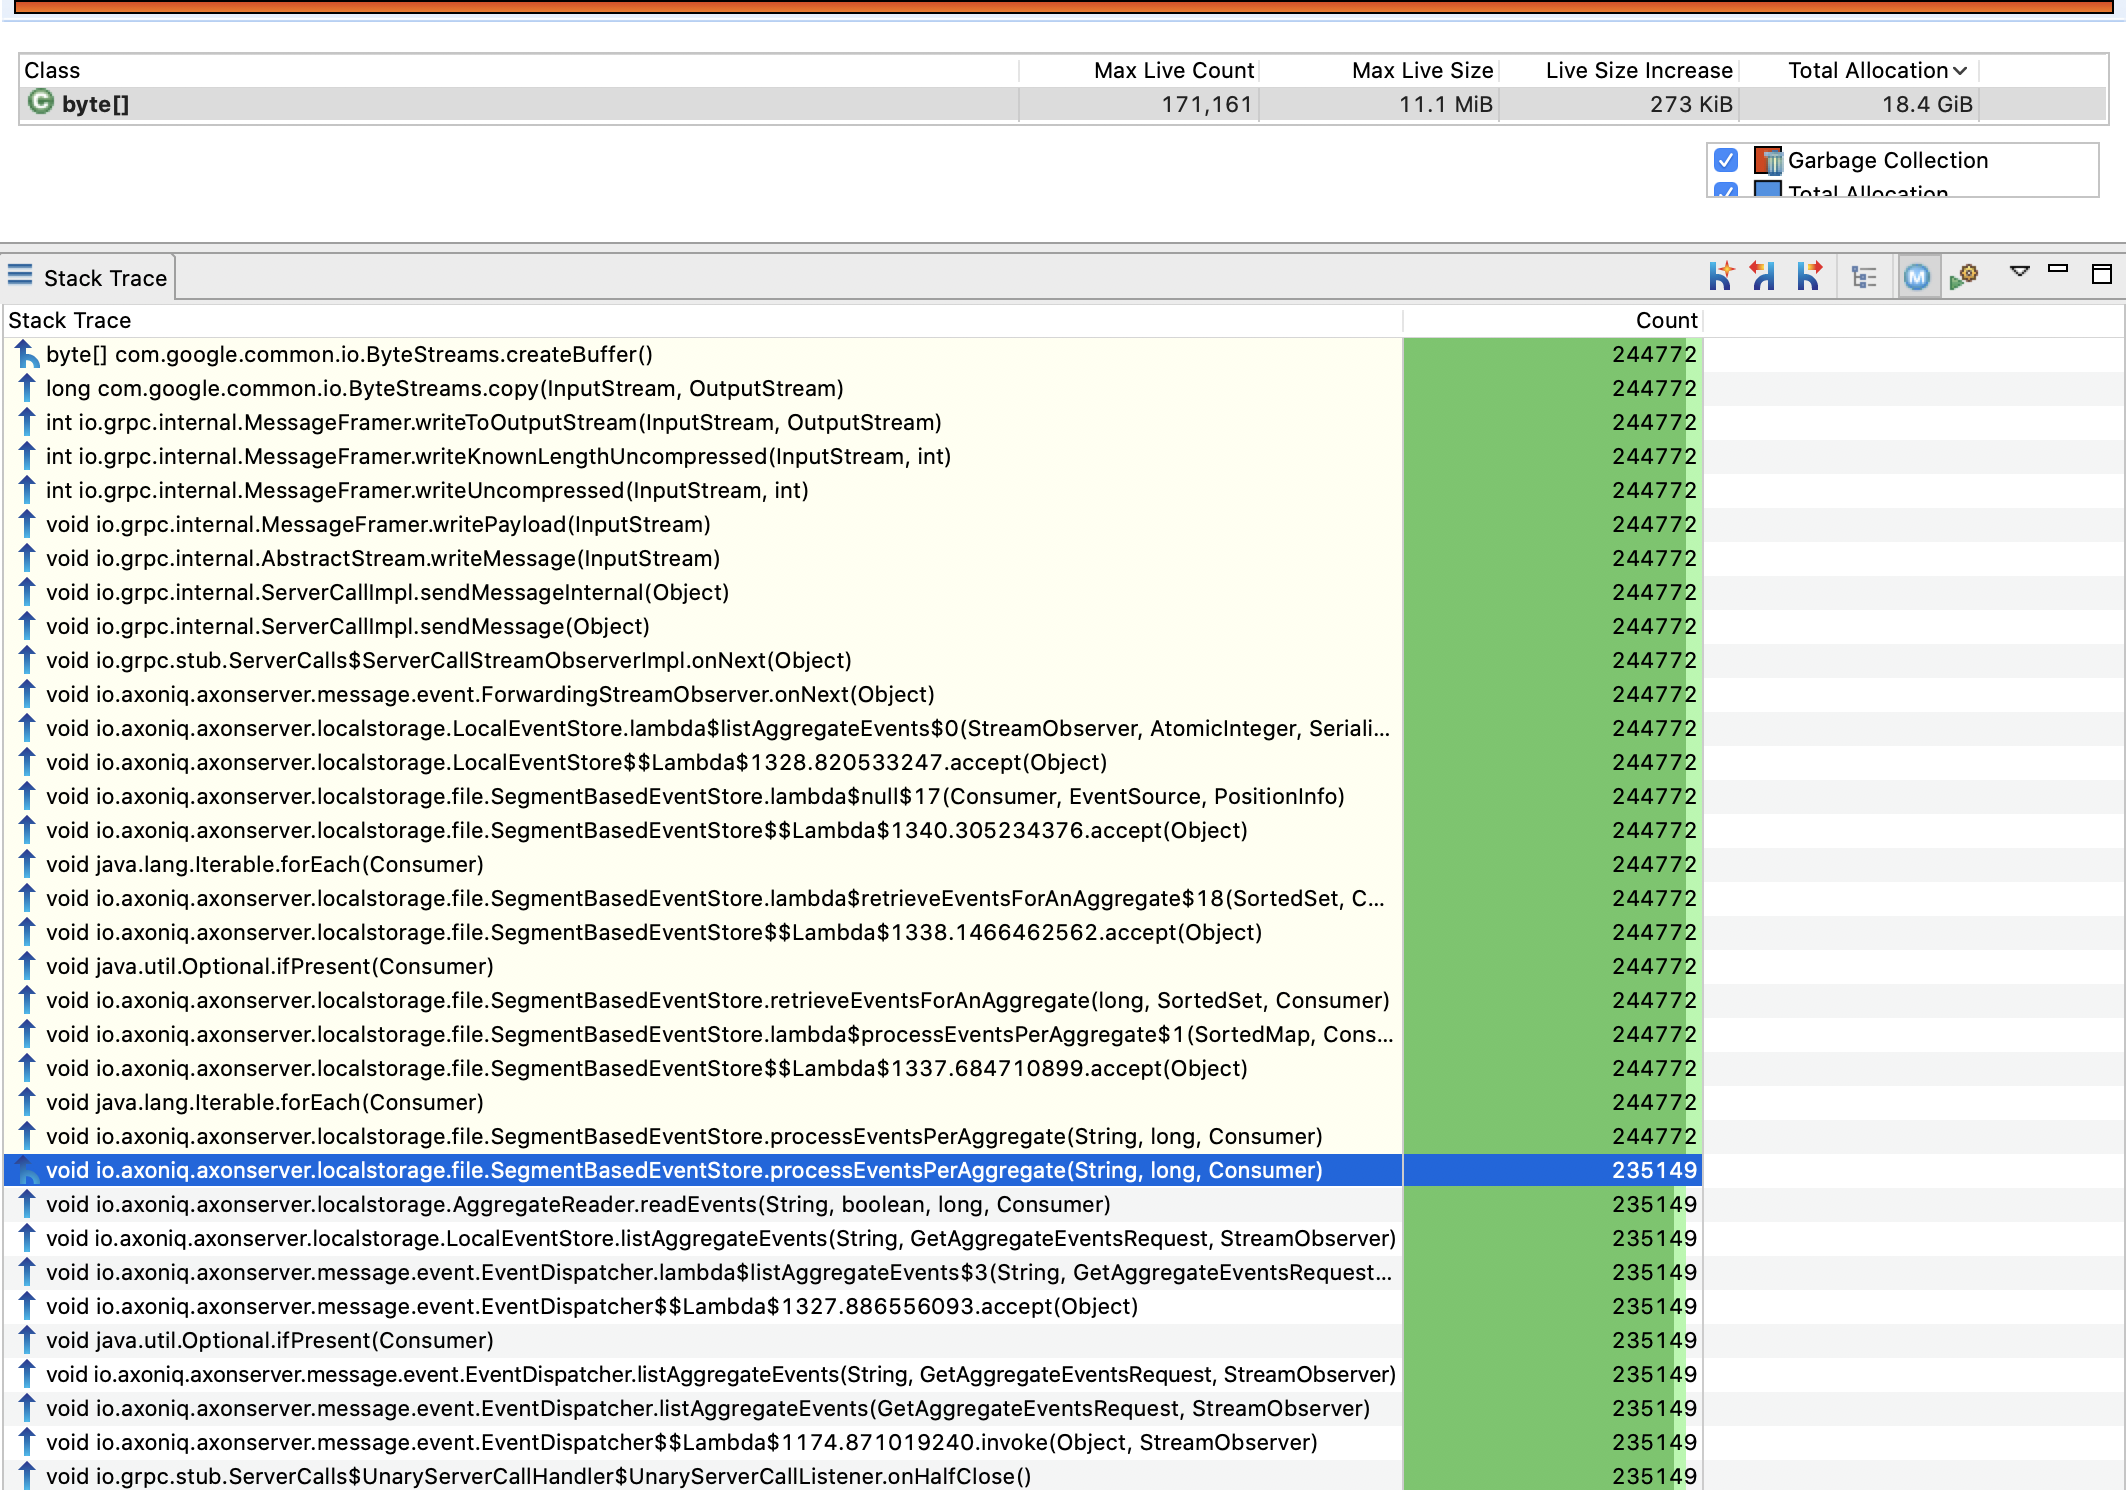
Noticed also relatively high heap pressure for the following stack trace for read aggregate events.
Is it doing full events read from the beginning or some of the latest ?
Decided to bring back snapshots and check if that will help (I’ve turned them off initially for test, thought that their creation could affect performance; planned on using projections only)
At first didn’t seem to affect speed, but now it is 10x faster about 700 - 750 events per second.
So probably it is indeed doing aggregate recreation on appending new events.
Going to leave that way for a while and see how it goes.
it seems that it’s not so much AxonServer slowing down, but the process of rehydrating aggregates taking longer, as AxonServer is forced to go further back in time to read the events. As a result the process of rebuilding the aggregate and generating the next event takes longer.
Snapshots help mitigate that problem to some extent. In performance-sensitive environments, we heavily recommend using caching to prevent the need to read events from the event store. In that case, AxonServer will only go back 1 event, to validate that the event that is appended has a higher sequence number.
Indeed AxonServer does not need a large heap size. 1Gb will get you a long way. AS does prefer Direct Memory (and leave some for the OS for the memory mapped files). When running on jdk <11, make sure you enable the G1GC.
Thanks!
Using caching event sourcing repository improved 10x times appending speed.
Didn’t know axon server have to rebuild aggregate periodically without explicit call - repository.get( aggregateId )
Just curious, how often does it happen ?
And those properties you mentioned, didn’t find them anywhere.
Is there a place where I can find their and probably other useful properties description ? Found only basic properties like event and snapshot store, etc…
If you don’t configure anything, the aggregate is loaded from the event store each time. So for high-performance environments using either caching or snapshotting is pretty critical.
What kind of properties are you looking for, exactly?