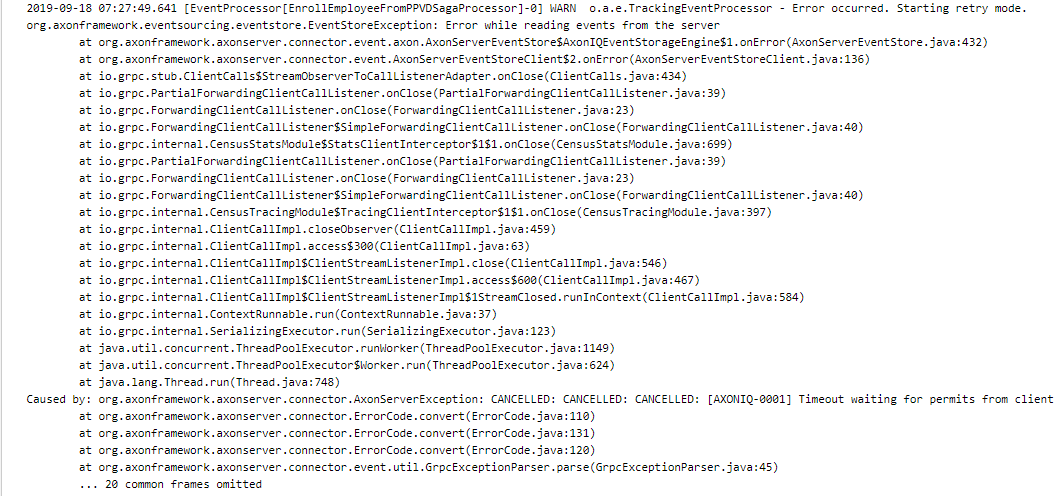
We have a problem that a Saga processor cannot read events from the server.
Unfortunately, we only get a generic exception so we have no way of telling it for sure, but we have an idea which event is causing the error.
Said event does not have an @Revision annotation, nor does it have an @TargetAggregateIdentifier.
As a result: aggregateIdentifier, aggregateType and payloadRevision are empty.
This event was built with the idea that the event is only relevant for a Saga. The Saga event handler’s associationProperty is present in the event payloadData.
We are aware that we are misusing the concept of sagas here.
My guess is that the target aggregate identifier being empty is the problem.
However, I do not know if I can simply add this annotation without adding an upcaster.
Would you know what could be causing this error and what the steps are that must be taken in order to fix this issue?
If the event I subscribed cannot result in said error, I’d also like to hear so I can continue my quest for searching the bad event(type).
which version of Axon Framework and Axon Server are you using?
The exception refers to the lack of permits, which are used for flow control between client and server. The client doesn’t seem to request new messages for too long, causing the server to stop the stream.
We are using Axon version 4.1.1.
Our axon-amqp-spring-boot-starter version is 4.1.
Axon server is running inside a docker container at version 4.1.2.
I have browsed through the events and found that the saga published its last event at approximately 08:08:26 today (18th), which was based on an event which was published yesterday at approximately 07:46:20 (17th)
update:
Restarting Axon server seems to have helped a bit.We are currently not getting any errors.
However, the saga in question is processing events at an extremely low rate (e.g. 1 event every minute).
1 event per minute is definitely below any acceptable threshold that we have. First, I’d recommend updating. Both AxonServer and AxonFramework have had updates since 4.1.2 and 4.1.2 respectively. If possible, you could migrate to Axon 4.2, otherwise you should at least update AxonServer to 4.1.7 and Axon Framework to 4.1.2.
If the problem persists, please share some logs that you’re seeing. They should provide some details on what’s happening in the other 59,999 seconds each minute.
During these 4 timeouts, 4 events were handled in the saga.
After this Axonserver logs were idle and no more.
Every once in a while an event seems to come through, but this happens in intervals between 1 to 6 minutes.
Axon logs in our Spring application are currently on INFO logging since this is a problem on our Production environment.
With this setting, we see no logs from Axon.
We are only seeing incoming JMS messages in our application but they should not interfere with the Axon messages.
I could try to set in on DEBUG if that would help?
I have also added the following config to the Spring application. No luck there unfortunately.
what does this Saga actually do? Could it be possible that the SagaEventHandler just takes that long to complete? Axon uses tracking processors by default, handling all events in a single thread, in sequence. AxonServer will happily serve a few thousand events per second on that thread, putting the bottleneck more in the actual handling than the delivery.
Are you seeing this behavior on your development environment as well? In that case, profiling should indicate what’s going on.
Having upgraded Axonserver we decided to hold everything for a while to let all sagas catch up.
The Axonserver dashboard was a great help in monitoring this!
We restarted the process and everything seems to work now.
I also noticed that our database was running at 100% CPU at that time and was being queried non-stop by Axonserver.
Catching up probably took longer than expected which, in combination with the large load on the database, caused events to be processed so slowly.
The other sagas had no logging which also explains why we did not see anything happening there.
Thanks for your quick help! It allowed us to find and solve the problem rapidly.