When the query store is nearly finished reading events it generates an OutOfMemory error. We see the same behavior across multiple query stores, and the error seems to pop up only if multiple query stores are processing events at the same time (on the same host).
Attach you 'll find some screen shots:
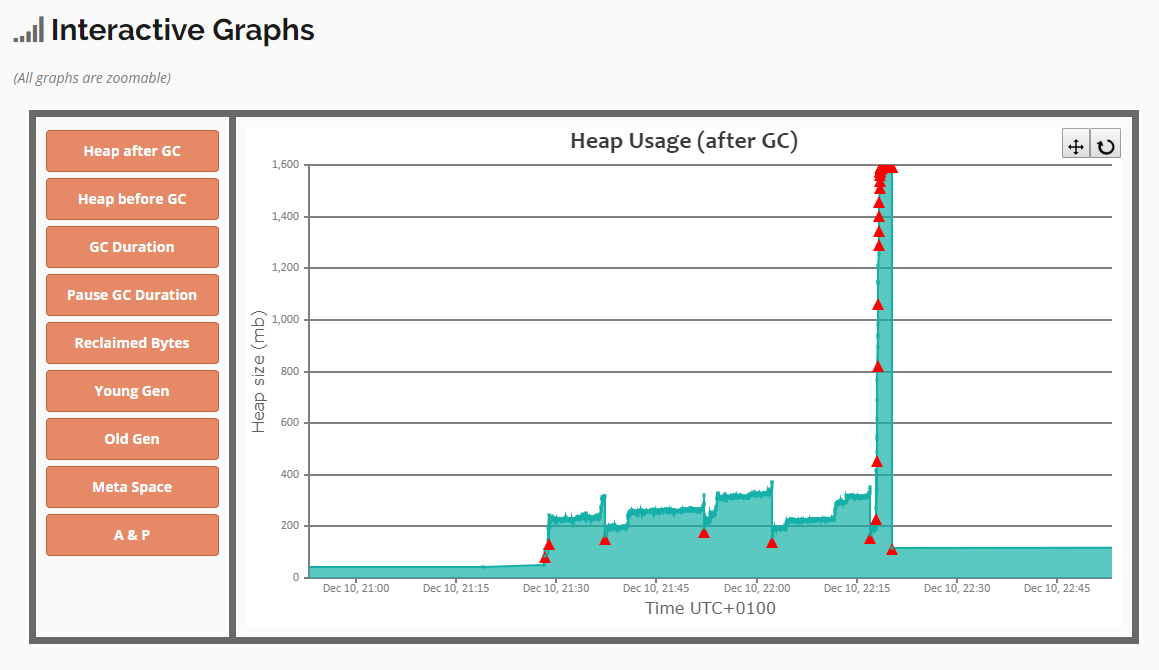
HeapUsage - Notice the major increase in the heap size
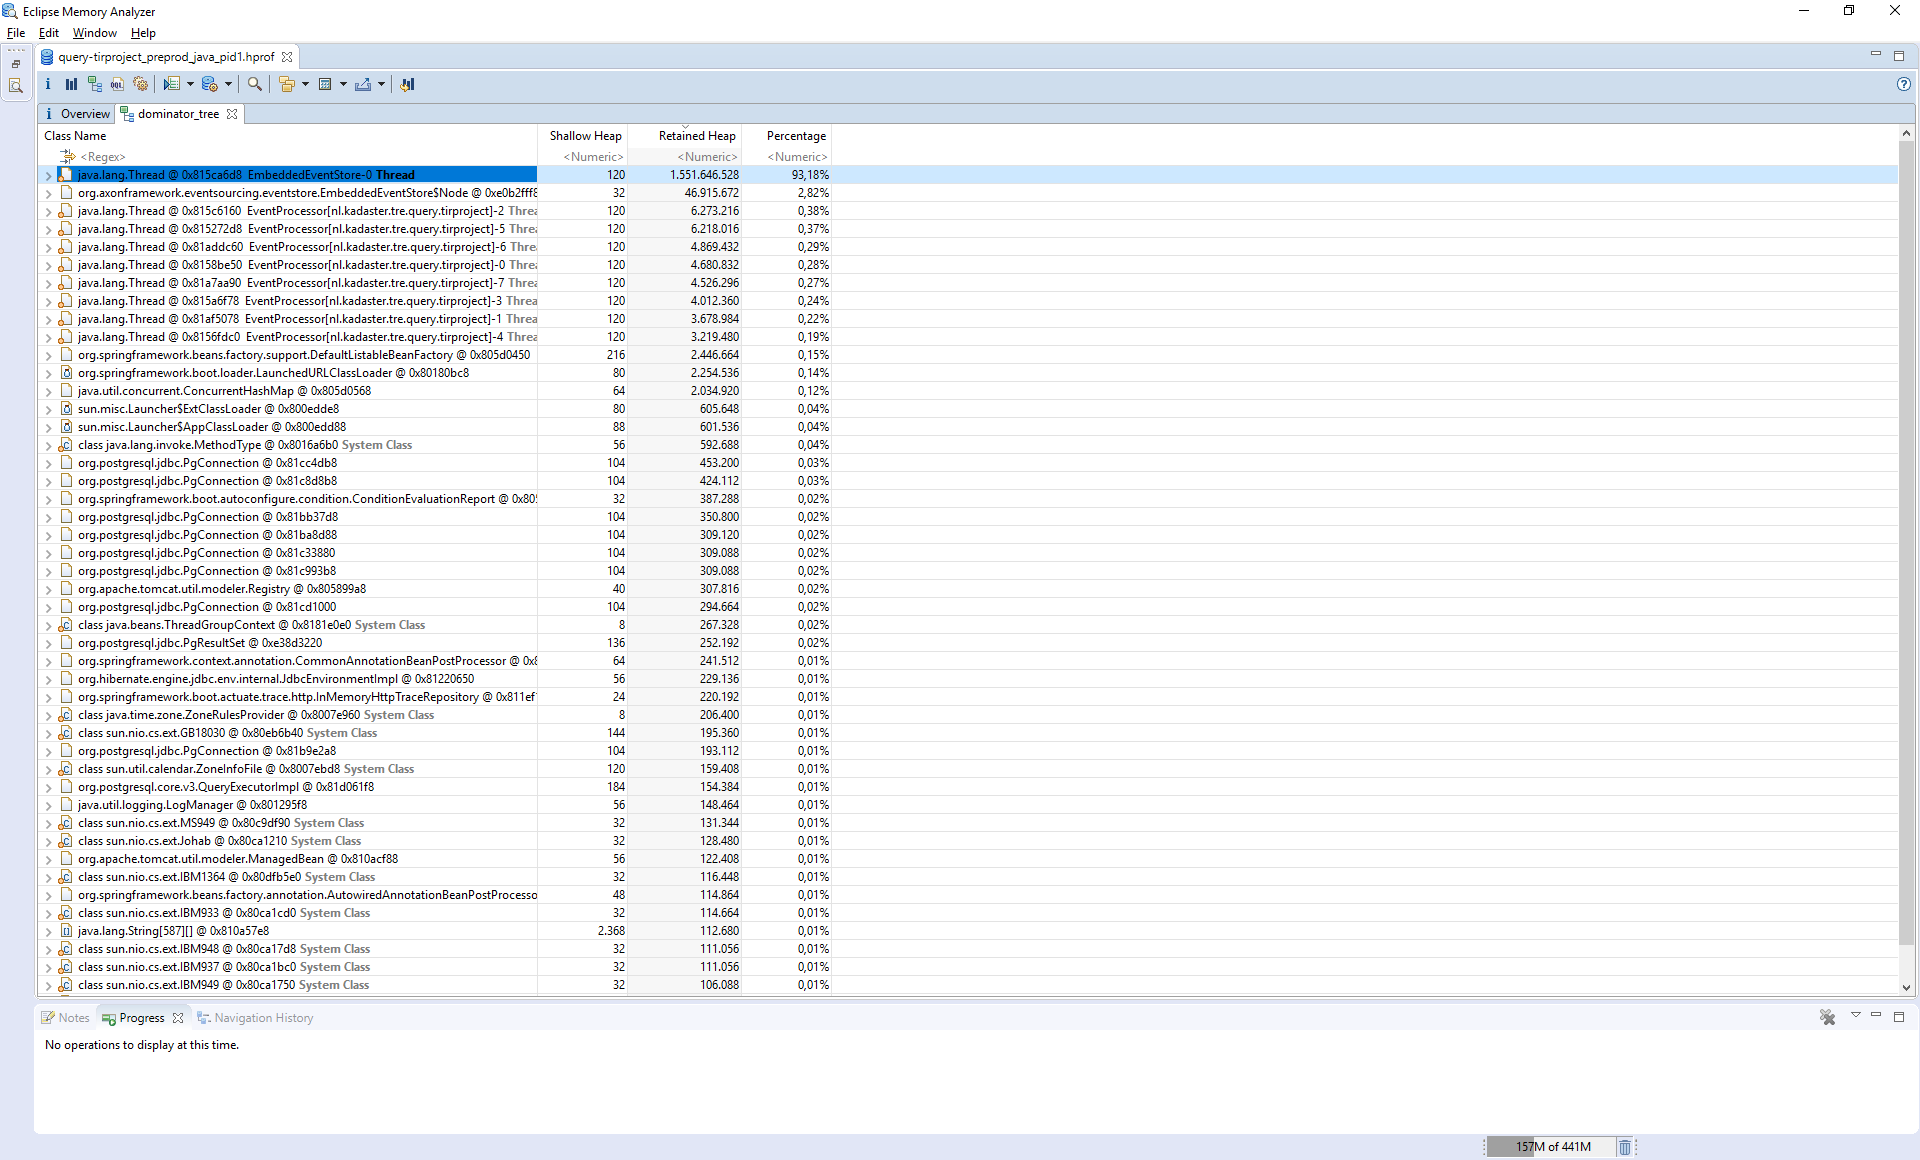
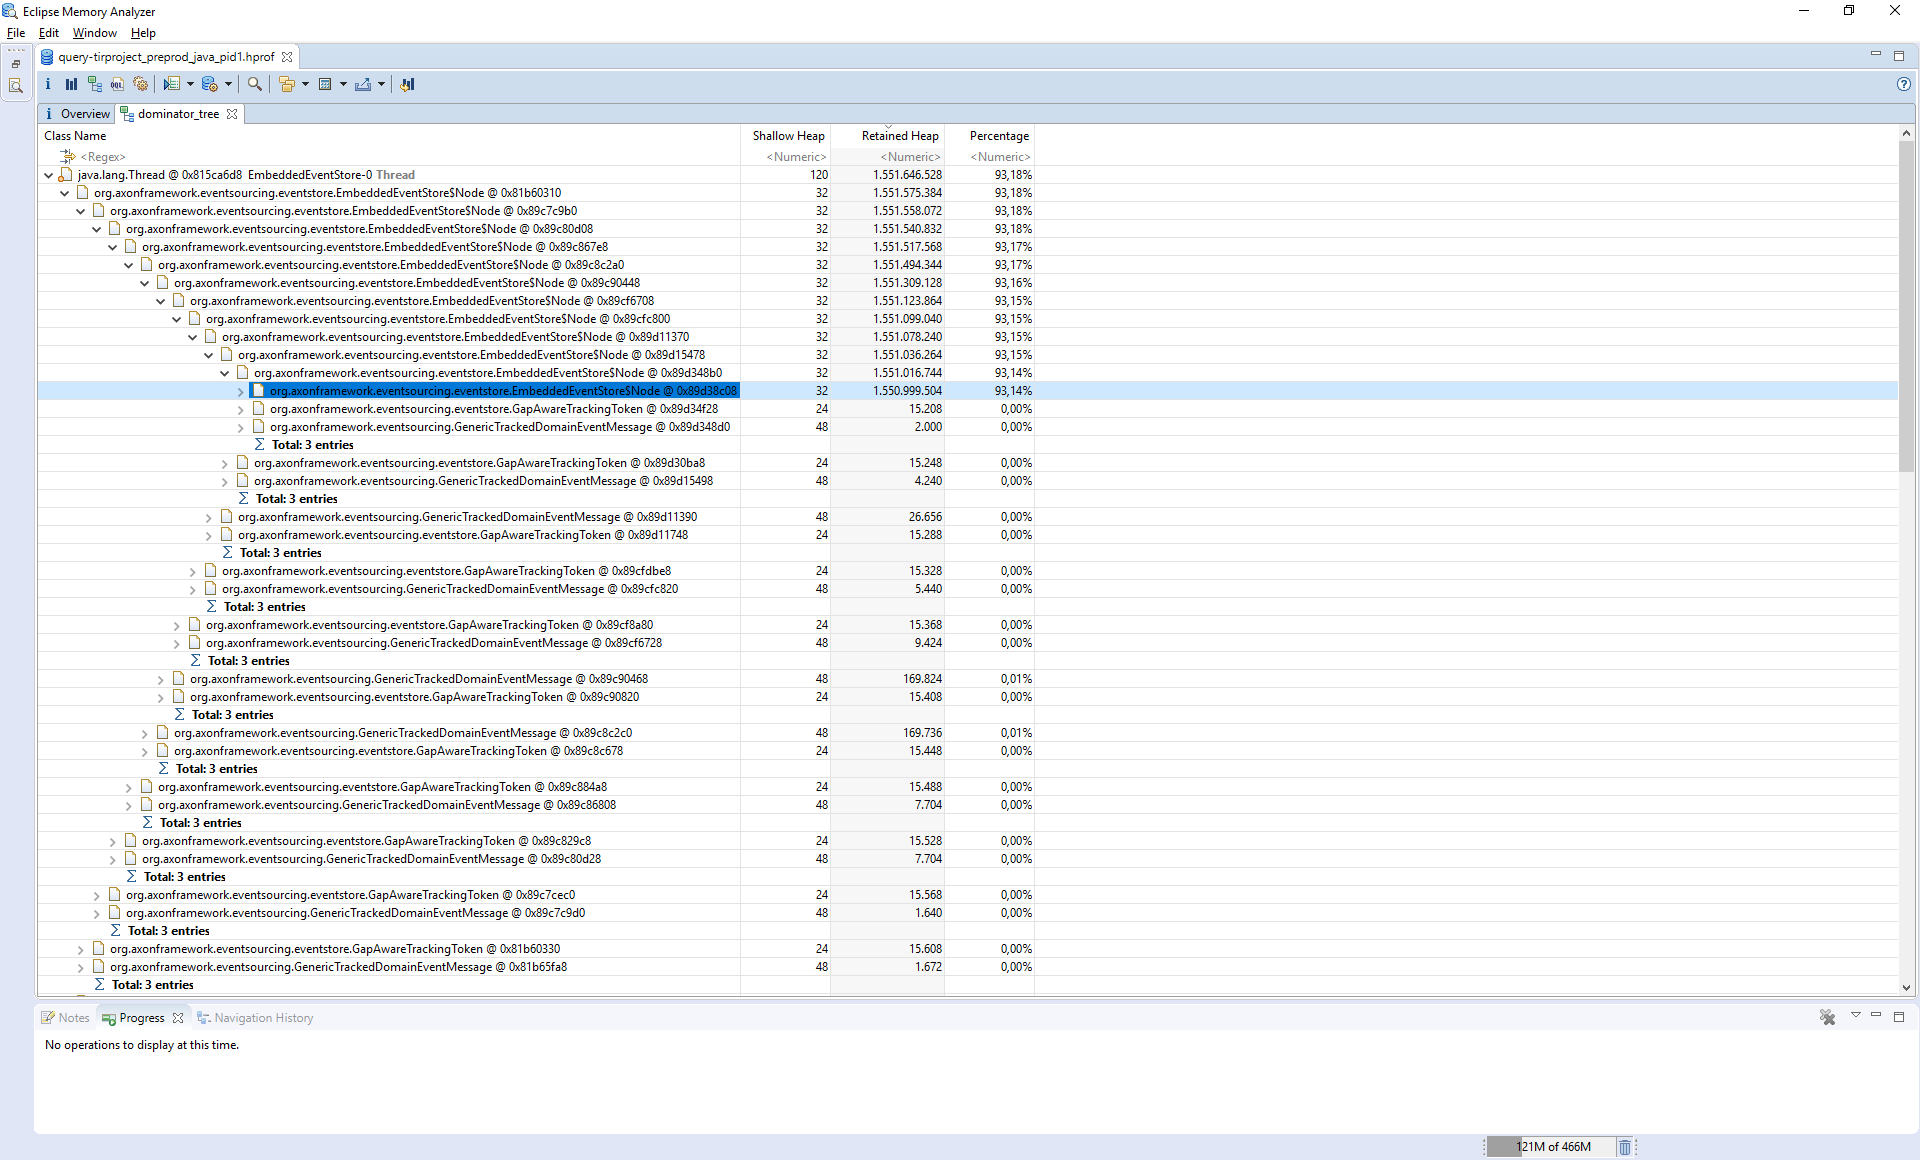
HeapDump1 - Notice the part of the heap the EmbeddedEventStore claims
thanks for posting that heap dump analysis with your question. It has proven very valuable in finding the culprit.
The EmbeddedEventStore$Node class is involved in some “optimization” to reduce I/O towards a database when multiple tracking processors stream the same data. This process starts when the first processor hits the “head” of the stream. From that point onward, the event store will use its own thread to read events, from which the processor threads can then read them. This allows a single instance of an event to be consumed by all processors.
We’ve already seen that this optimization had some undesired side-effects (thread creation on EE environments, additional complexity in handling gaps and cleanup), so we have added a flag that allows you to switch this process off.
In the EmbeddedEventStore.Builder, you can specify builder.optimizeEventConsumption(false), which turns this off completely.
Alternatively, if you don’t want to switch this process off, you can specify howmany Events the EmbeddedEventStore should queue (using builder.cachedEvents(…), which defaults to 10000).