I am wondering if anyone has put effort in hooking up an Axon application to a distributed tracer like e.g. Zipkin ? I am trying to make our cluster a bit more transparent and observable and have gotten some good results already. But what is missing currently in my setup is the Axon part, most notably command dispatching over the jgroups cluster.
I remember from last year in Amsterdam that Allard was saying some effort would go into the 3.x version to accomodate this, has any work been done there ? We’re still on 2.x, so this could be a justifiable driver for me to finally migrate to version 3
Zipkin and Sleuth provide transactional tracing. In a high volume distributed Axon environment the focus shifts to anomalies and errors. I am not aware of completed work in this area at the moment.
Thanks for your thoughts, I had seen the MRI tool but it’s static analysis so not terribly useful for my purpose.
Zipkin / Sleuth / Opentracing / Jaeger / Census / Pinpoint etc are all tools attempting to do the same. I suspect there will be many more to come as the distributed tracing market is starting to emerge. Main thing I retained is that there is no all encompassing tool (and never will be) that is going to give you 100% insight into everything on the button, custom development will always be required. A framework like Axon could provide generic tracing hooks (command received, dispatched, AR / Sagas invoked, EventHandlers called etc) that would make it easier to plug the tracing infra. Again I remember vaguely something being in the pipeline for 3.x, hoping Allard will chime in on this
As far as the anomalies and errors go you might be able to leverage something like prometheus, but the tool will only ever be as good as the metrics you provide it with. Thanks for linking your blog btw, it’s very insightful !
I think what Allard revered to back then was the MessageMonitor set up, which has been introduced in Axon 3.x and resides in the axon-metrics module.
The MessageMonitor gives you the option to add several metrics upon handling messages in the CommandBus, EventBus and the EventProcessor (somewhat similar to Axon 2.x’ Clusters).
We’ve got several defaults in place, but it’s quite easy to introduce your own.
Steven is right about the MessageMonitor being added in Axon 3, which gives you some hook points to trigger monitoring behavior. That combines with the ability to specify CorrelationDataProviders, which attach headers to outgoing messages (potentially) based on the headers of an incoming message, gives you the building blocks to build a tracing mechanism.
At AxonIQ, we’re also seeing the potential of large-scale tracing & monitoring and realize that Axon is in a very nice position here (architecturally speaking). On our roadmap, there is a product that will (using the building blocks in Axon Framework), provide monitoring capabilities for Axon based systems. We anticipate two forms to monitor. the first is the tracerbullet, which is basically a message with a header that causes the monitoring tool to ‘light-up’ and specify the times at which cause and effect of this message arrive at different components. The other is an sla based monitoring, where you specify how long the time between two components reacting on events should be. For example, you can specify that a two read models should be consistent within a certain timeframe. Axon will report the consistency levels (allowing monitoring tools to react on values going beyond sla).
Thanks Allard. I will have a look at MessageMonitor. Does it automatically transport the tracing context over jgroups or spring cloud or is this work to be done by the application?
Thanks for explaining a bit the AxonIQ tracing and monitoring roadmap, curious how this is going to evolve. Let me mention also a third option though, if it’s somehow not covered already: ensure that when Axon is called as part of a larger service orchestration or call stack (e.g. it’s only one of 10 backends involved in handling a client request) that it can accept and use existing trace contexts passed in by the caller throughout it’s execution path. So more or less this picture here http://eng.uber.com/wp-content/uploads/2017/02/8-Screen-Shot-Trace-View.png with the Axon backend being just one of the services involved.
the MessageMonitor is mainly just a mechanism to trigger timers etc. for a message being processed. The CorrelationDataProvider is the mechanism that attaches headers to messages being created within the processing context of another message. The JGroups and Spring cloud connectors will always forward headers on messages, so this correlation information is also automatically published.
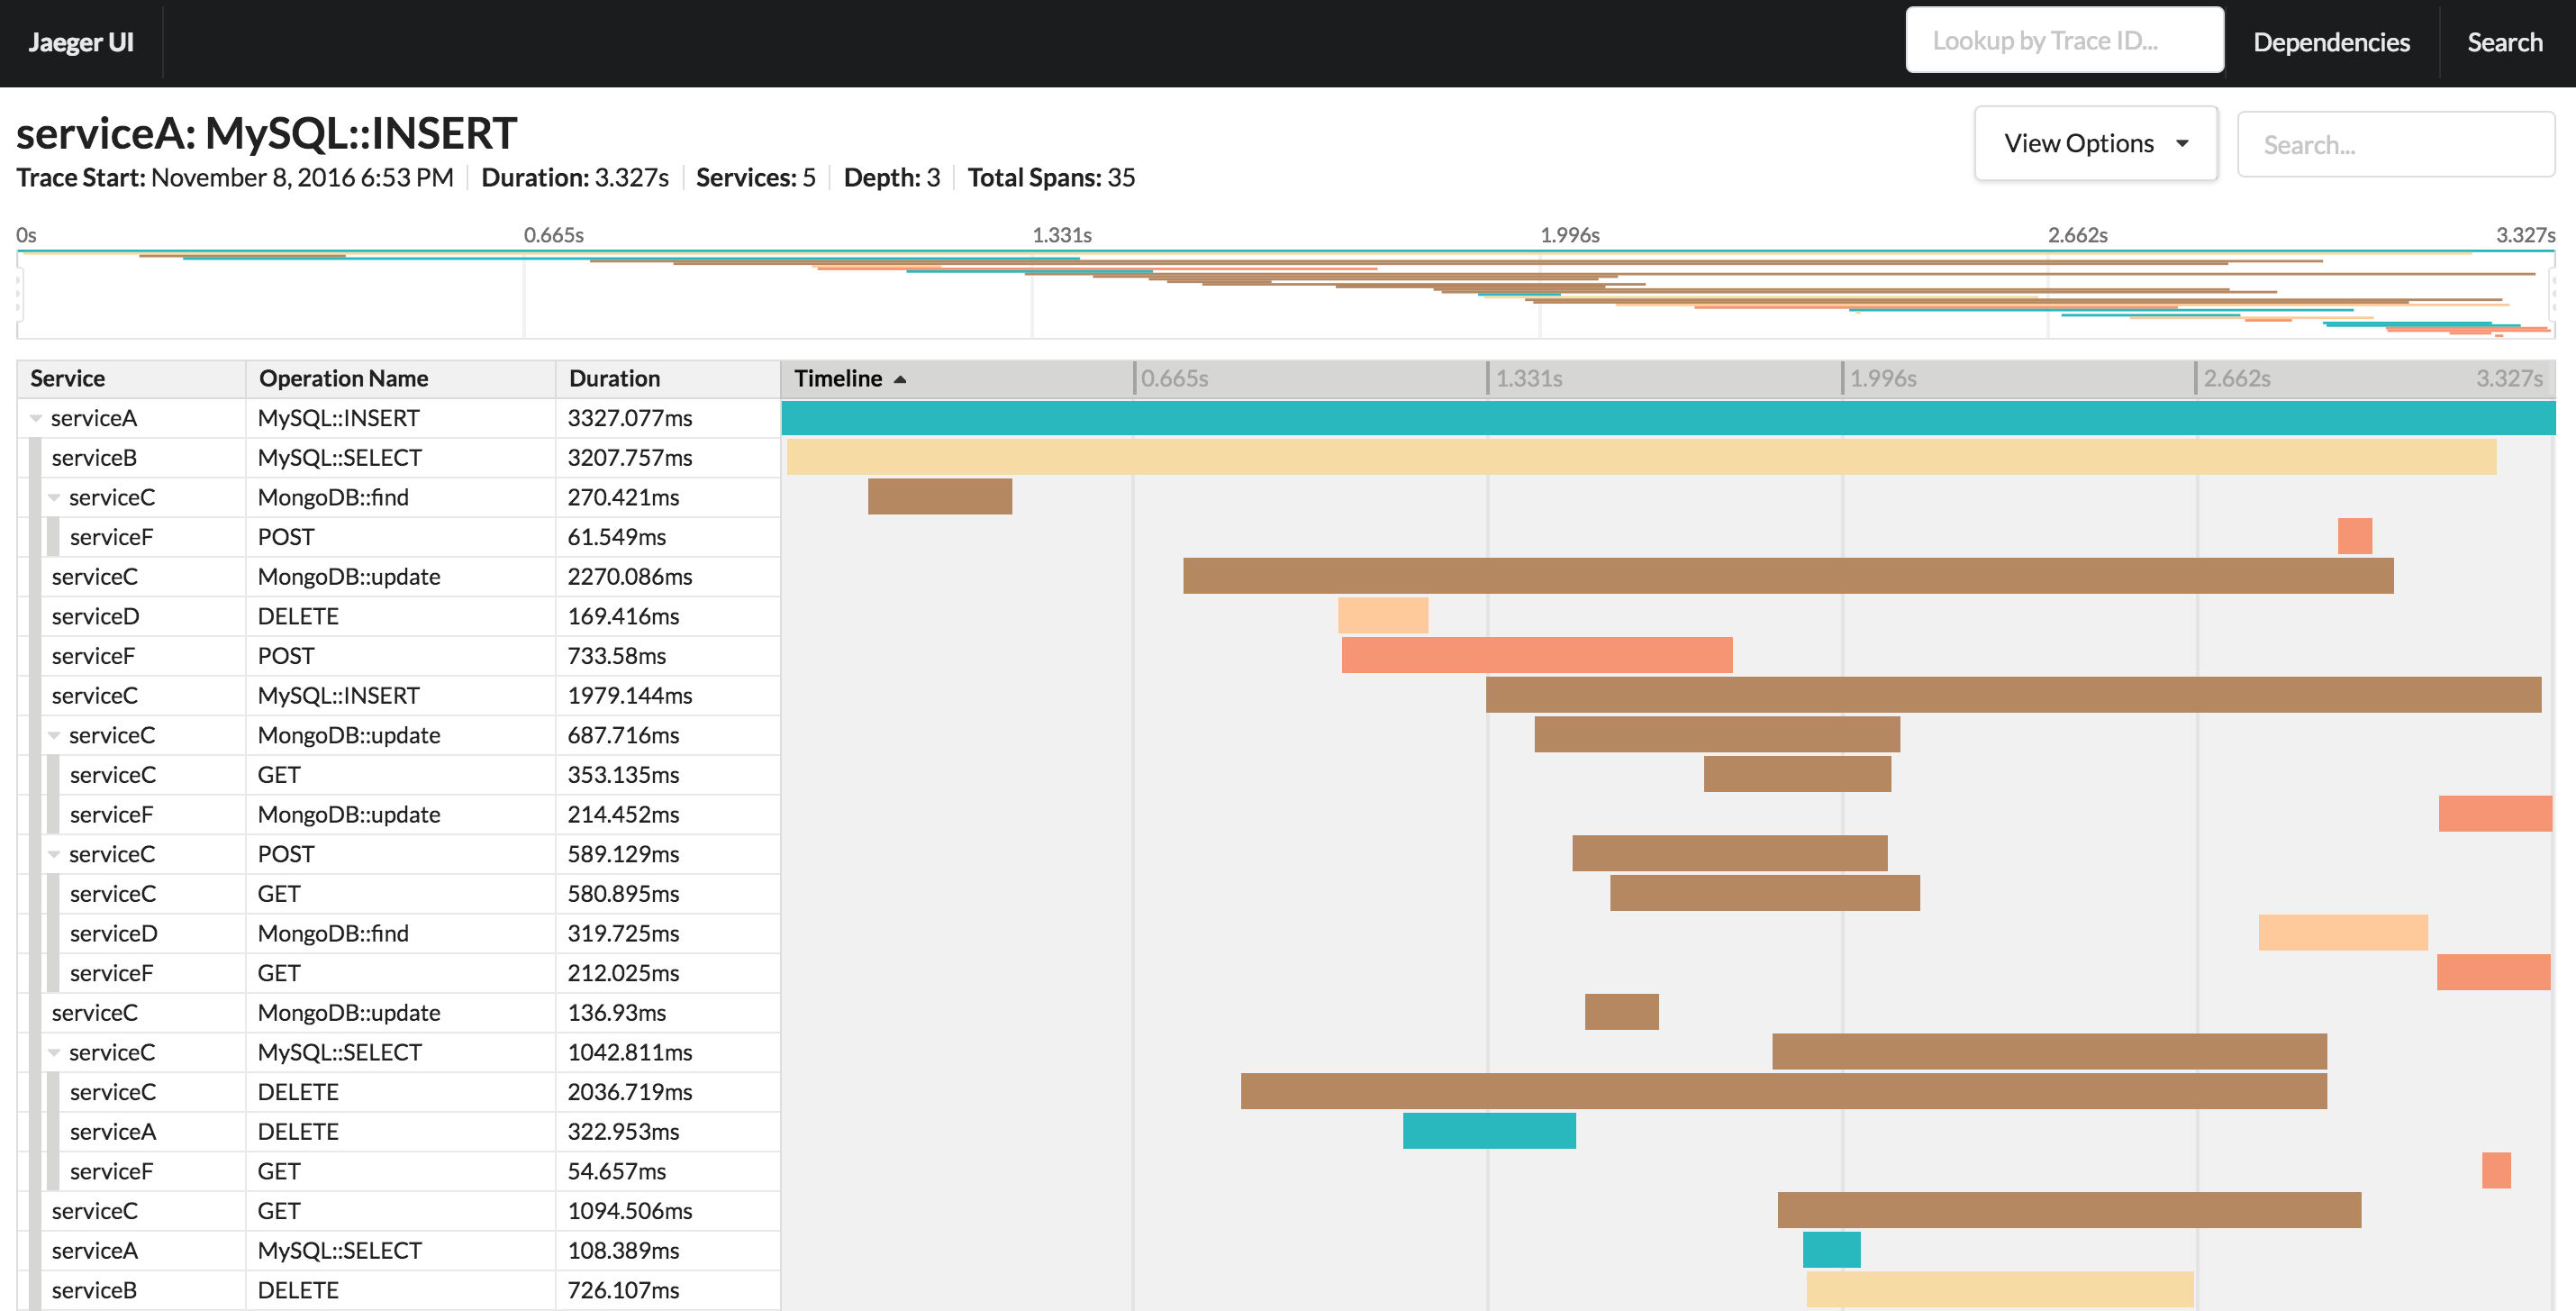
With regards to the AxonIQ monitoring features, it will basically be triggered by a specific header, which defaults to an Axon specific header. However, it could be possible to have it triggered by something else. However, the idea is to inject only certain messages with the headers for real-time tracing, so that the overhead is small. You’d probably want Trace and Span headers on every message, so that you can analyse transactions ‘offline’, just like the Jaeger screenshot in your email. This is probably information that you only want to show once a specific threshold is reached (e.g. total processing time), instead of proactively storing and processing it.
We’ll keep you posted as soon as things are starting to take shape.
Cheers,

