Hello
I’m using axon framework with spring boot version
org.axonframework:axon-spring-boot-starter:4.3.3 (exclude group: ‘org.axonframework’, module: ‘axon-server-connector’)
Recently I’ve started noticing certain business workflows halting suddenly and when I checked the logs I found this exception
Command 'com.example.MyCommand' resulted in org.axonframework.common.lock.LockAcquisitionFailedException(Failed to acquire lock for aggregate identifier(AGG_ID), maximum attempts exceeded (100))
This started occurring suddenly and its getting more frequent with time.
The aggregate is configured to use snapshotting
@Bean public SnapshotTriggerDefinition MyAggregateSnapshotTriggerDefinition(Snapshotter snapshotter) { return new EventCountSnapshotTriggerDefinition(snapshotter, 200); }
This aggregate only has a few running instances and they remain alive for a very long period of time (years)
I read that this exception is thrown if a process seems to hold a lock on the aggregate for far too long, meanwhile a command requested the lock and timeouted waiting for it.
The aggregate does not hold a big amount of data
@Aggregate(snapshotTriggerDefinition = "MyAggregateSnapshotTriggerDefinition")
public class MyAggregate {
   @AggregateIdentifier
   private String aggId;
   private boolean paused;
   private int pausingChangelist;
   private RequestCause pauseCause; //enum
   private Seat seat;
   private Queue<Reservation> reservationQueue;
   private boolean canPauseBuildPool;

  ...

}
NONE of commands dispatched to this aggregate are sent in “sendAndWait” mode.
All commands have a small payload and there is no heavy computation being done in the command Handler methods. Its litreally checking some boolean flags and raising events.
The event sourcing handlers on the other hand do some logic.
They manipulate the reservation queue by polling and inserting reservations.
@EventSourcingHandler
public void on(CertainEvent event) {
    // poll from queue if not empty
    // raise SeatReservedEvent
}

@EventSourcingHandler
public void on(SeatReservedEvent event) {
    // reserve seat
}

@EventSourcingHandler
public void on(SeatFreedEvent event) {
    //  free the seat
    // poll from queue
    // if queue not empty -> raise SeatReservedEvent
}

@EventSourcingHandler
public void on(SeatReservationQueuedEvent event) {
    // add to queue
}
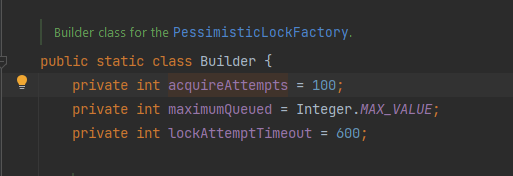
The weird thing as well, I checked other posts where this same exception is thrown and they seems all to have the exact same error message but mine is the only that has a different number of attempts (100)
LockAcquisitionFailedException: Failed to acquire lock for aggregate identifier(AGG_ID), maximum attempts exceeded (2147483647)
I read the code of the PessimisticLockFactory and was able to understand that this number (2147483647) represent the number of time a process tried to acquire the lock on an aggregate.
Why is 100 only in my case? (NO extra config was added from my side)
How can I solve this issue? how can I monitor the locks on the aggregate? how to know what process aquired the token and wouldn’t release it?